Lin HANa, Jiehui XIEa, Shuting LIUa, Xueying LUa, Yanyang WANGa, Yating LIUa, Shifeng LIUa
a. QingCheng AE Institute (Guangzhou) Co., Ltd, 232 Kezhu Road, Guangzhou 510663, China
Corresponding author: xjh@ae-ndt.com
ABSTRACT
Acoustic emission source localization is the basic function of the application of acoustic emission technology. For complex structures, mathematical analysis positioning algorithms cannot be obtained, and accurate acoustic emission source localization cannot be obtained, which has always been one of the problems in the actual applications of acoustic emission technology. To solve this problem, this paper proposes an acoustic emission source localization method based on deep learning, which can obtain high-precision acoustic emission source positioning without the need for mathematical analysis positioning algorithms. The AI deep learning acoustic emission source localization method adopts the method of meshing, dividing the grid in the measured structure, generating label data at the grid position, using the label data to conduct AI deep learning training to establish a positioning model, and using the trained model to analyze the actual acoustic emission data (non-labeled data) to locate the acoustic emission source. This paper uses a multi-layer perceptron model to train multi-dimensional features (arrival time and amplitude). This method effectively improves the accuracy of acoustic emission source localization. Experimental results show that the positioning accuracy of the designed deep learning model in the test set reaches 99.625%, which is significantly better than the traditional Time Difference of Arrival (TDOA) positioning algorithm. In addition, this paper further verifies the stability and reliability of the model in localization tasks through credibility metrics such as Score, Margin and Entropy. This article provides a new solution for locating acoustic emission sources in complex structures, and lays a theoretical and practical foundation for the future development of non-destructive testing technology.
Keywords:
deep learning; acoustic emission; source localization; AI; artificial neural network; meshing.
Acoustic Emission (AE) technology is an important non-destructive testing method that monitors the sound wave signals released by materials under stress in order to evaluate their internal defects and structural integrity. In recent years, with the increasing requirements for safety and reliability of industrial equipment, the application of acoustic emission source localization technology in the engineering field has become more and more extensive. Especially in the monitoring of complex structures (such as hydraulic metals, bridges and aircraft, etc.), traditional acoustic emission localization methods face great challenges. For complex structures, mathematical analytical localization algorithms cannot be obtained, so accurate acoustic emission source localization cannot be obtained.
At present, traditional acoustic emission source localization technologies are mainly based on the time of arrival (TOA) and the time difference of arrival (TDOA) algorithm, such as plane positioning algorithm, cylindrical positioning algorithm, spherical positioning algorithm, etc. Complex structures have irregular shapes and structures, and it is impossible to obtain the algorithm expression of analytical mathematical positioning, so accurate positioning cannot be obtained.
In addition, acoustic waves are affected by many factors when propagating in materials, such as material inhomogeneity, geometric shape and boundary conditions. Traditional algorithms are often unable to effectively deal with problems such as complex sound wave propagation and signal attenuation, which will also reduce localization accuracy or even make it impossible to obtain meaningful localization accuracy results.
This paper proposes an acoustic emission source localization technology based on artificial intelligence deep learning. The core idea of this technology is to divide the structure under test into multiple grids and use sensors to collect the arrival time and amplitude information of the acoustic emission signal in each grid. By training these signal features through a deep learning model, the positioning feature combination of the acoustic emission signal can be effectively extracted, thereby achieving high-precision source localization. Compared with traditional methods, the method proposed in this study can do without or require no analytical mathematical positioning algorithms, and still maintain high positioning accuracy and accuracy under uncertain conditions such as complex acoustic wave propagation and background noise.
Specifically, the technical framework of this study includes: first, constructing an artificial neural network (ANN) suitable for acoustic emission signals to analyze and process multi-channel signals; second, designing experiments to verify the effectiveness of the proposed method, and training and optimizing the model through a large amount of experimental data; finally, combining the experimental results and comparing with traditional acoustic emission source localization methods, the performance advantages of the new method are analyzed.
In summary, this study not only provides an innovative solution for AE source localization in complex structures, but also provides feasible ideas for subsequent applications in other fields. By introducing deep learning technology, we expect to improve the accuracy and robustness of AE source localization, thereby providing more reliable technical support for industrial detection and safety assessment.
ANN is a mathematical model that imitates biological neurons. It has powerful nonlinear mapping capabilities and is widely used in signal processing, pattern recognition and classification tasks. This study uses a multilayer perceptron (MLP) network structure based on deep learning to achieve accurate localization of acoustic emission sources.
2.1.Input Layer Design
According to the experimental design, sensors were arranged at the four corners of a 400mm × 400mm square steel plate, which was divided into 16 grids of 4 × 4, as shown in Figure 3.1. The signal in each grid was received by 4 sensors, which recorded the arrival time and amplitude of the acoustic waves. In order to ensure that the model could effectively extract these signal features, the number of input layer nodes was set to 8, as follows:
The first four nodes: represented the TDOA of the acoustic emission signals recorded by the four sensors. The arrival time recorded by each sensor reflected the difference in the time for acoustic waves to travel from the source to the sensor, and was significantly related to the location of the sound source.
The last four nodes: represented the signal amplitude recorded by the corresponding sensor. Amplitude information represented the energy attenuation experienced by sound waves during propagation. There were significant differences in the amplitudes of signals emitted by AE sources in different grids reaching each sensor.
The input layer was designed to make full use of the arrival time and amplitude information to achieve accurate localization of the acoustic emission source through nonlinear feature extraction.
2.2.Output Layer Design
The goal of the experiment was to determine the specific location of the acoustic emission source in the 16 grids. Therefore, the number of nodes in the output layer was set to 17, of which 16 nodes corresponded to each grid and the last node represented the error status. The output layer used the Softmax activation function, and its formula was as follows:

where, was the input of the kth node of the output layer, and C was the number of categories (which was 17). The Softmax function converted the network output into a probability distribution, ensuring that the value of each output node was between 0 and 1, and the sum of the probabilities of all outputs was 1. By selecting the node corresponding to the maximum probability as the classification result, the grid where the acoustic emission source was located can be effectively determined.
2.3.Hidden Layer Design
In order to improve the nonlinear fitting ability of the network, this study adopted a two-layer hidden layer structure, each with 50 nodes. The number of nodes in the hidden layer was selected based on the following principles:
According to the empirical formula, the number of nodes in the hidden layer could be calculated by the geometric mean of the number of nodes in the input layer and the output layer:

where  .Therefore, the theoretical number of hidden layer nodes should be:

However, based on the actual application experience of deep learning and in order to enhance the learning ability of the network, 50 nodes per layer were actually selected to improve the network's complex pattern learning ability and nonlinear feature extraction effect.
A single hidden layer might not be able to capture high-order features in the input signal, while a two-layer hidden layer structure could effectively increase the nonlinear mapping ability of the network and help the network learn the complex features in the acoustic emission signal.
The hidden layer nodes used the ReLU (Rectified Linear Unit) activation function, and its mathematical expression is:

The advantage of the ReLU activation function was that it was simple to calculate and could effectively solve the gradient vanishing problem in traditional activation functions (such as Sigmoid and Tanh), thereby accelerating the network training process. In addition, ReLU could also enhance the sparsity of the network and help improve generalization ability.
2.4.Network Structure Diagram
In summary, the final network structure was shown in Figure 2.1:
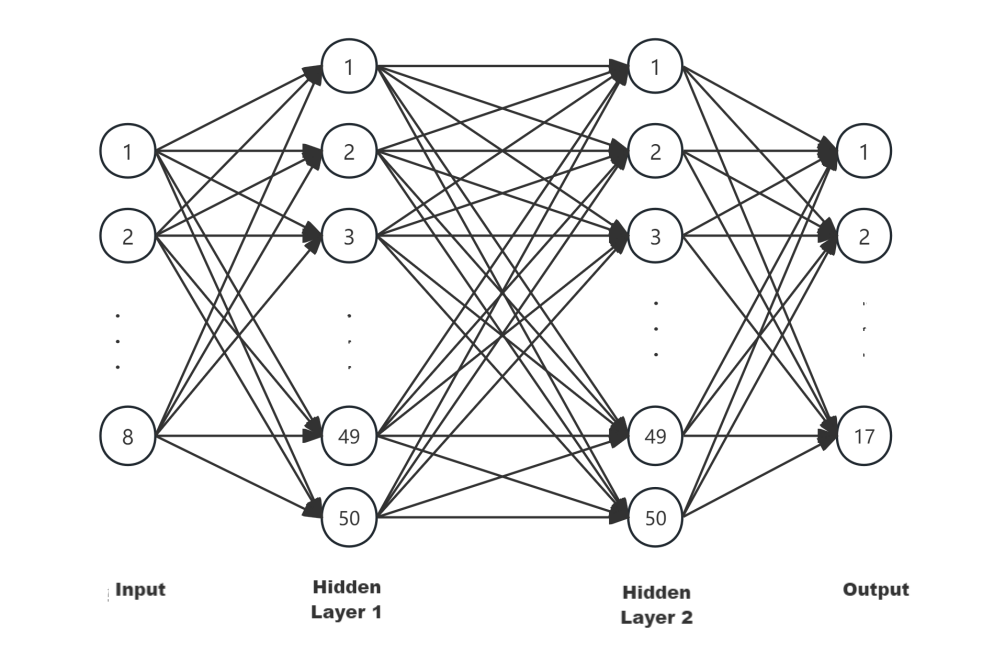
Fig. 2-1 Network Structure Diagram
2.5.Training and Optimization Algorithms
This study used the Backpropagation Algorithm combined with the Gradient Descent method to optimize network parameters. The Backpropagation algorithm calculated the difference between the network output and the actual label, propagated the errors backward layer by layer, and then updated the network weights and biases. In order to speed up the training speed and ensure the stability of the gradient update, the Mini-Batch Gradient Descent algorithm was used in the training process, and the batch size was set to 64.
The loss function adopted the Cross-Entropy Loss function, and its formula was as follows:

where  was the actual label and
  was the predicted probability. The cross-entropy loss function guided the update of network weights by measuring the difference between the actual category and the predicted category.
The network was optimized using the gradient descent algorithm with a learning rate of 0.001. In addition, the learning rate decay strategy was adopted to gradually reduce the learning rate as the training progresses to avoid falling into the local optimal solution too early.
The purpose of the experimental design was to verify the effectiveness of the proposed deep learning-based acoustic emission source localization method. This section introduced in detail the specific implementation methods of grid division, sensor layout, data acquisition and preprocessing, model training and evaluation indicators during the experiment.
3.1.Meshing and Sensor Placement
The experiment used a 400mm × 400mm square steel plate as the experimental platform. In order to locate the acoustic emission source, the steel plate was divided into 16 grids (each grid was 100mm × 100mm), and each grid represented a potential acoustic emission source location. Four GI150 acoustic emission sensors from Qingcheng Ltd were arranged at the four corners of the steel plate, numbered channel 1 to 4, and their arrival time and amplitude information were collected and recorded by Qingcheng’s SAEU3H multi-channel acoustic emission acquisition instrument. The collected data were respectively applied to both the traditional acoustic emission TDOA algorithm and the training and verification of the above-mentioned ANN, in order to compare the location accuracy of the two methods.
The grid division and sensor layout were shown in Figure 3.1, and the actual picture was shown in Figure 3.2.
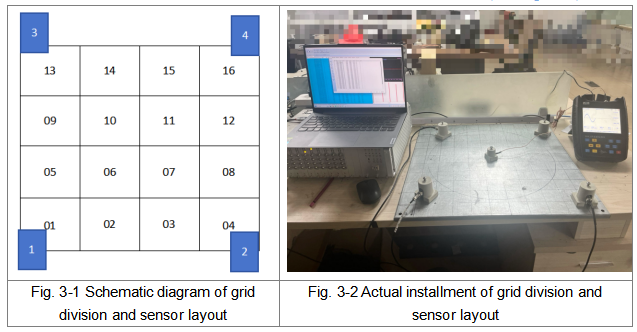
where Sensor 1 to 4 were located at four corners respectively, and were responsible for collecting acoustic emission signals at different positions of the steel plate.
3.2.Acoustic Emission Signal Generation and Acquisition
In the experiment, a signal generator was used to generate an acoustic emission signal in each grid. The signal type was selected as a standard triangular wave, with the constant frequency and amplitude. The signal was repeated for 500 times in each grid to ensure the diversity and representativeness of the data. A total of 500×4×16=32,000 sets of parameters were collected in the experiment.
Among them, the data of 400 signals generated in each grid were used for neural network training, and the data of the remaining 100 signals were used to verify the model performance.
3.3.Data Preprocessing
In order to ensure the consistency of input data and the convergence of the model, the collected acoustic emission signal data must be normalized. The input data contained the arrival time and amplitude information, and were preprocessed according to the following steps:
Normalization of the arrival time: First, sort the arrival times in a descending order, and then subtract the earliest arrival time from all arrival times. So that the absolute arrival time became the relative arrival time difference, and the smallest arrival time difference was 0. Defined the maximum time difference as a normalization parameter, and the maximum time difference can be set to the time difference of the acoustic wave propagating along the diagonal of the steel plate. Finally, all arrival time differences were divided by this maximum time difference to complete the normalization process.
Amplitude normalization: Since the maximum amplitude was 100dB, all amplitude values were divided by 100 to ensure that the normalized amplitude value was between [0, 1].
The normalization formula was as follows:
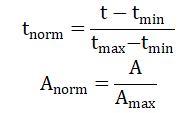
where  was the minimum arrival time,
 was the maximum arrival time,and
 was the maximum amplitude value 100dB.
Output data processing: The labels of the output data was discrete classification values from 0 to 16, corresponding to 16 grid numbers and error states respectively. The output data used One-hot encoding, which meant the node of the target grid output “1”, and other nodes output “0”. If the prediction was wrong, the 17th node output “1”.
The preprocessed data was shown in Figure 3.3 below:

Fig. 3-3 Normalized arrival time and amplitudes
3.4.Neural Network Model Training
The preprocessed data was used to train the neural network model. The input layer contained 8 nodes, which represented the arrival time of 4 sensors and the amplitude of 4 sensors. The output layer contained 17 nodes, representing 16 grids and 1 error state. The specific structure of the model was consistent with the network design described in Section 2.2.
During the model training process, the data was divided into a training set and a validation set. The data of 400 signal transmissions was used for training, and the data of 100 signal transmissions was used for validation. In order to prevent overfitting, cross validation and Dropout regularization techniques were used. Mini-Batch Gradient Descent method was used in the training process. The batch size was set to 64 and the initial value of the learning rate was set to 0.001. After each batch was trained, the network weights and biases were updated.
The loss function of the model used the Cross Entropy Loss, and the calculation formula was as follows:

where  was the One-hot encoding of the real label, and
  was the predicted probability of the network.
During the training process, the loss function value and accuracy on the validation set were recorded every 100 epochs. If the loss of the validation set no longer decreased, the training was stopped in advance to avoid overfitting.
4.1.Training and Validation Results
During the training process, the cross entropy loss function was used for optimization, and the changes in the loss function during the training and validation phases were monitored. The Loss function calculation formula was as follows:

The loss function was a function that measured the difference between the predicted and actual values of a neural network model. From Figure 4.1, it can be seen that the training loss value gradually decreased with the increase of training rounds and eventually stabilized below 0.01.
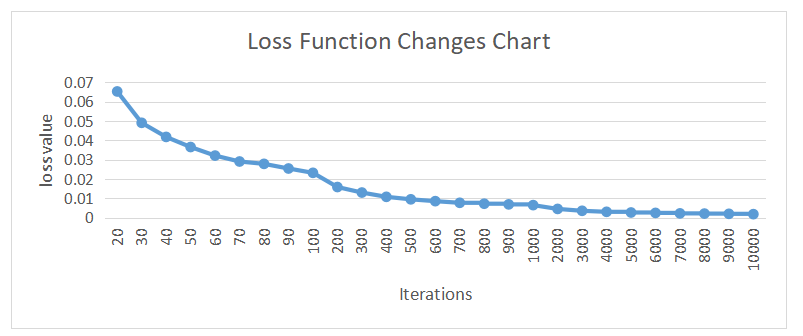
Fig. 4-1 Loss Function Changes Chart
The Score function was defined as: Score = the maximum value among the current 17 output nodes, which indicated the confidence of the model in predicting the correct category.
Figure 4.2 was the curve of the Score function change. It illustrated that the Score value gradually increased during the training process and finally stabilized at around 0.99. This value was close to 1, indicating that the model had an extremely high confidence in predicting most categories.
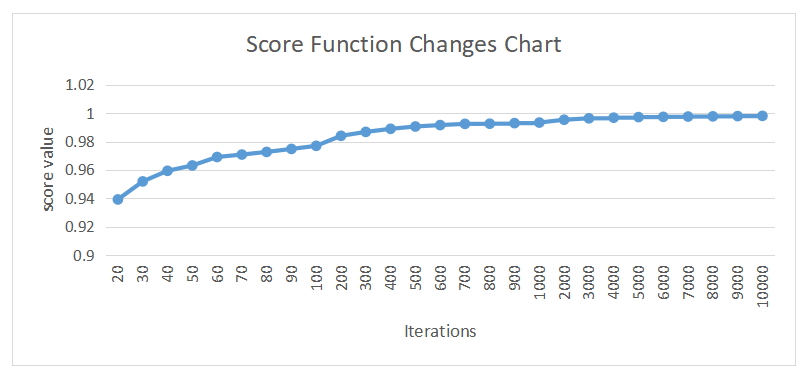
Fig. 4-2 Score Function Changes Chart
The Margin function was defined as: Margin = the maximum value of the current 17 output nodes - the second largest value of the current 17 output nodes, which represented the difference between the optimal category and the suboptimal category. The larger the Margin, the stronger the model's confidence in the classification result.
Figure 4.3 was the Margin function change curve. It can be seen from the figure that as the training progresses, the Margin value gradually increased and eventually stabilized above 0.98. This showed that the model could effectively distinguish between the optimal category and the suboptimal category when making classification decisions, reducing the occurrence of misclassification.
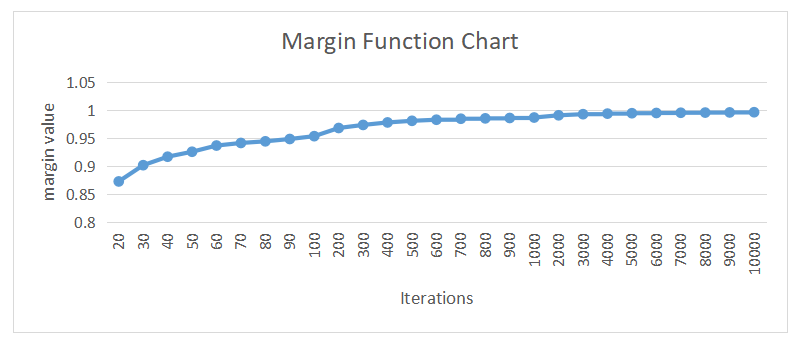
Fig. 4-3 Margin Function Changes Chart
The Entropy function was used to measure the distribution of the model's prediction results. A smaller Entropy value indicated that the prediction results were more concentrated. It was defined as:

Figure 4.4 showed the variation curve of the Entropy function. It can be seen from the graph that the Entropy value gradually approached below 0.5 with the change of training epochs. This meant that the predicted distribution of the model was concentrated and had strong classification stability.
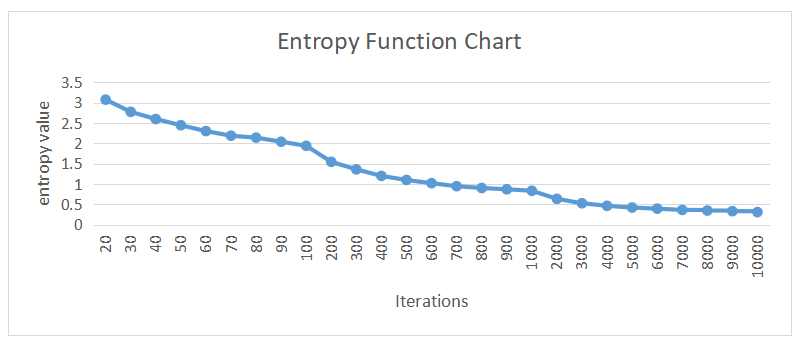
Fig. 4-4 Entropy Function Changes Chart
The credibility of the recognition result was shown in Figure 4.5 below:
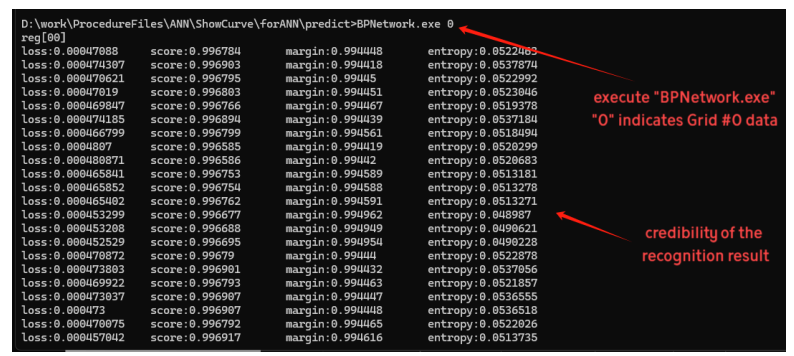
Fig. 4-5 The credibility of the recognition results
4.2.Model Performance Evaluation
Grid numbering started from 1. The recognition errors in the experiment were as follows: four data of grid No. 2 were mistakenly recognized as grid No. 3; two data of grid No. 8 were mistakenly recognized as grid No. 4.
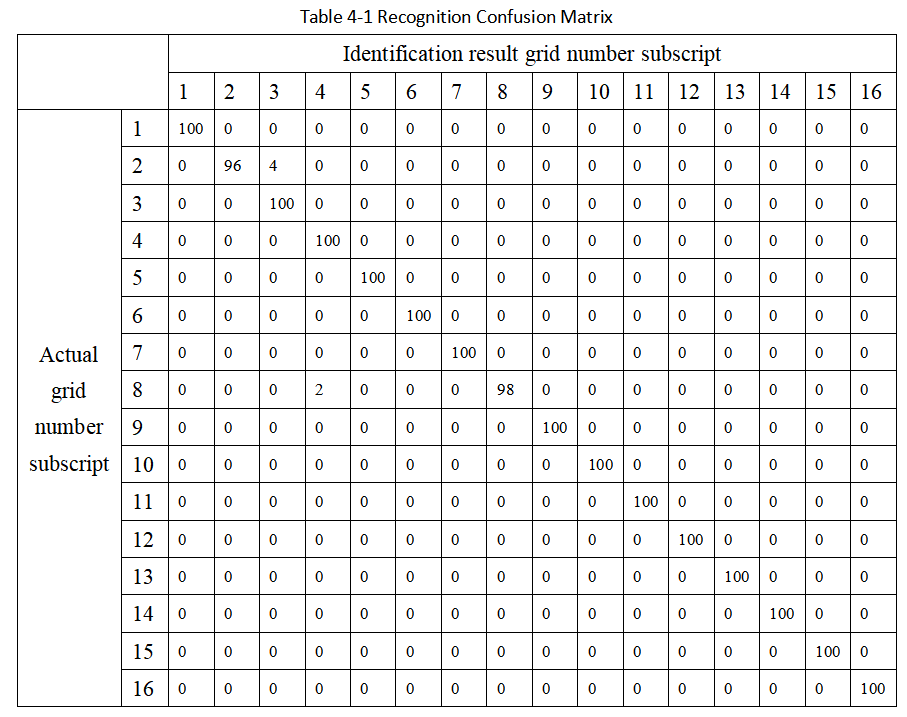
The performance of the model on the test set was evaluated by indicators such as Accuracy, Precision, Recall, and F1 Score, which were defined as follows:
TP (True Positive): True positive, the model predicted a positive example, and it was actually a positive example.
FP (False Positive): False positive, the model predicted a positive example, and it was actually a negative example.
TN (True Negative): True negative, the model predicted a negative example, and it was actually a negative example.
FN (False Negative): False negative, the model predicted a negative example, and it was actually a positive example.
Accuracy: The accuracy of the model's overall classification of test data was defined as:

Among them, TP was True Positive, TN was True Negative, FP was False Positive, and FN was False Negative.
Precision: The proportion of samples correctly classified as positive examples in a specific category.

Recall: The proportion of correctly classified samples that were actually positive examples in a specific category.

F1 Score: The harmonic mean of precision and recall was given by the formula:

According to the experimental results, the calculation of relevant indicators was shown in the following table:

From the above results, the model performed very well on the test set, with extremely high accuracy, precision, recall and F1 score. The model could accurately locate the positions of most acoustic emission sources with almost no false positives.
4.3.Comparison With Traditional Acoustic Emission Localization Methods
To further verify the superiority of the deep learning method, we compared it with the traditional acoustic emission TDOA method. The accuracy of the traditional TDOA algorithm was defined as: the number of acoustic emission location sources falling within the corresponding grid was divided by the number of emitted pulse signals (500). The accuracy of AI deep learning acoustic emission source positioning was defined as: the number of times the current grid correctly identified was divided by the total number of data identified in the current grid.
In this test, the results of AI deep learning acoustic emission source localization were: Grid No. 2 had a total of 100 data identified, of which only 4 were recognized incorrectly; Grid No. 8 had a total of 100 data identified, of which only 2 were recognized incorrectly; the remaining grids each had 100 grid data identified, and all were correctly identified.
The results were shown in Table 4.2.
Table 4-2 Comparison of the accuracy of traditional TDOA method and deep learning method
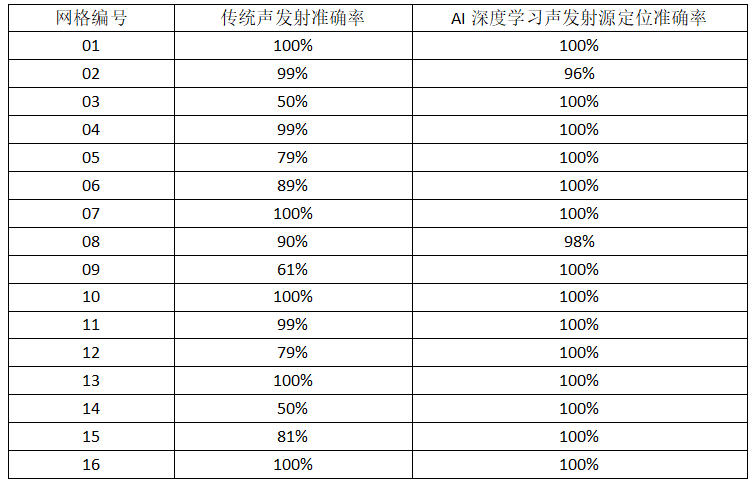
Since a small metal plate was used in the experiment, the acoustic signal was easily affected by the superposition of reflected waves. So the positioning accuracy of the traditional time difference algorithm was low. However, the accuracy of the deep learning method in each grid was much higher than that of the traditional TDOA method. Especially in the difficult-to-position grids No. 03, 05, 09, 12, 14 and 15, where the traditional TDOA accuracy was not high, the deep learning method still maintained a high accuracy of 100%. This showed that the deep learning method had stronger robustness and the ability to handle complex scenes.
This study proposed a deep learning based acoustic emission source localization method to address the limitations of traditional acoustic emission source localization methods. By dividing the tested structure into grids and combining it with a multi-layer perceptron model to deeply mine multidimensional features, a high-precision acoustic emission source localization model was successfully constructed. The experimental results showed that the designed neural network model achieved a localization accuracy of 99.625% in 16 grids. In addition, the analysis of reliability indicators such as Score, Margin, and Entropy showed that the model had high confidence in classification decisions and could avoid most misclassification and missed classification problems. At the same time, the model could accurately identify most of the true positive samples (high recall rate), while maintaining a low false positive rate (high accuracy rate), and the balance between the two was good (high F1 score), demonstrating the excellent comprehensive performance of the model. In summary, despite the poor performance of traditional methods, deep learning methods still maintained high accuracy, proving their suitability for non-destructive testing tasks of complex structures.
Although this study has made significant progress in acoustic emission source localization, future work can further explore applications in more complex structures, such as inhomogeneous materials, special-shaped structures, etc. At the same time, the diversity of training signals can be further enriched to ensure that a wider range of features can be learned and its generalization ability can be improved. Optimizing the model structure and improving the model's adaptability to dynamic scenarios will also be important directions for future research. In short, the acoustic emission source localization method based on deep learning provides strong technical support for health monitoring and structural integrity assessment of industrial equipment, and has broad application prospects.
[1]Y.Q. Zhu, Research on the method of locating acoustic emission signal source based on neural network [D], Chongqing University of Technology, 2023, DOI:10.27753/d.cnki.gcqgx.2023.000102.
[2]Z.H. Liu, Q.L. Peng, C.F. He, B. Wu, Time difference mapping method for acoustic emission source location of composite plates [J], ACTA ACUSTICA, 2020, 45(3): 385-393, DOI: 10.15949/j.cnki.0371-0025.2020.03.011.
[3]Y.Z. Liang, Study on acoustic emission source localization of carbon fiber composite damage based on machine learning [D], Hebei University, 2024, DOI:10.27103/d.cnki.ghebu.2024.002006.
[4]R.X. Yi, S.F. Liu, R.S. Geng, G.T. Shen, Application of Artificial Neural Network in Acoustic Emission Detection [J], Non-destructive Testing Journal, 2002, (11):488-491+496, DOI: 10.3969/j.issn.1000-6656.2002.11.008.
[5]X.M. Huang, Application of Neural Network Technology in Acoustic Emission Location [J], Journal of Shaoyang University (Natural Science Edition), 2007, (02): 26-29, DOI: 10.3969/j.issn.1672-7010.2007.02.008.
![]() Research on Acoustic Emission Source Localization Technology Based on AI Deep Learning
Research on Acoustic Emission Source Localization Technology Based on AI Deep Learning
